
Reach and Frequency Planning for Digital Brand Campaigns
Most digital brand plans are built backwards. The budget is set, the platforms are chosen, and reach and frequency fall out of whatever the algorithms decide to do with the money. The result is familiar: a campaign that reports millions of impressions but delivered most of them to the same few hundred thousand people, several times a day, while the bulk of the category never saw an ad.
Reach and frequency planning reverses the order. You decide who needs to see the brand, how often, and over what period, then buy media to hit those numbers. Here is how we plan it, and how to check it delivered.
Reach First, Then Frequency
The strongest evidence on how brands grow comes from the Ehrenberg-Bass Institute, and its planning implication is blunt: growth comes mostly from light and non-buyers, who are numerous, hard to reach and easily forgotten. A brand campaign that keeps hitting the same engaged audience is talking to people who already know it. Reaching more of the category, more often across the year, matters more than hammering a smaller group.
Continuity follows from the same logic. Buying happens every week, so a brand that disappears for months between flights is absent for most of the buying moments in its category. In our experience, a lower-weight, always-on presence beats an equivalent budget spent in two heavy bursts, unless there is genuine seasonality to concentrate around. Defining which moments matter is the job of category entry points: reach is only valuable if it lands when and where buyers are thinking about the category.
The Effective Frequency Debate
For decades planners chased an "effective frequency" of three exposures, a rule of thumb that hardened into doctrine. The later recency school argued that a single exposure close to purchase does most of the work, and that spreading weight across more weeks beats stacking exposures within one. No universal number exists: the right frequency depends on how known the brand is, how complex the message is, and how quickly the creative wears out.
What we can say with confidence is where frequency stops paying. Response to exposure shows diminishing returns: the first impression to a new person is worth far more than the eighth to someone who has already seen the ad all week. Creative built on strong distinctive brand assets needs fewer exposures to register, because each one is instantly attributed to the brand. Weak branding is often what people are compensating for when they demand higher frequency.
Using the Platform Planners
Both major platforms offer proper planning tools. Google's Reach Planner forecasts on-target reach, average frequency and "1+" to "10+" effective reach for video plans across YouTube, video partners and connected TV, counting unique people across devices rather than cookies. It is the quickest way to see where the reach curve bends for your budget. Access is still limited to qualified accounts, so check with your Google representative if it is missing.
On Meta, the old reach and frequency buying type now sits under reservation buying, which lets you book predicted reach at a fixed CPM with a frequency cap or target frequency, rather than leaving delivery to the auction. It suits larger audiences and committed flights, and it is not available to every advertiser. Within auction buying, frequency caps on reach-optimised campaigns are the minimum control we set.
Deduplicating Reach Across Channels
Each platform reports its own reach, and none of them knows about the others. Add YouTube, Meta, programmatic display and CTV together and the summed reach routinely exceeds the target audience, which tells you the overlap is real and unmeasured. A workable approach:
- Estimate combined reach with the random duplication formula (one minus the product of each channel's non-reach) as a baseline, then treat it as an upper bound, since digital audiences overlap more than random.
- Set frequency caps per platform with the combined total in mind; four exposures a week on each of three platforms is twelve for the people who use all three.
- Use brand lift studies and panel-based measurement where available to check the deduplicated picture, as covered in measuring brand lift.
A Worked Example: AUD 120,000 Over Eight Weeks
Principles are easy to agree with and hard to apply, so here is the arithmetic we run on a real plan, set out so you can replicate it in a spreadsheet. The brand is hypothetical and every number below is an illustrative assumption chosen to make the maths readable. None of the CPMs, curve parameters or reach figures are benchmarks, and your own platform planners and past campaign data should replace them before any money moves.
The Brief and the Budget
A mid-sized Australian home insurance brand wants to build salience ahead of its peak renewal season. The plan runs for eight weeks with a working media budget of AUD 120,000, or AUD 15,000 a week. The target audience is adults 25 to 54 in a defined metro market, which we will size at 2.4 million people. In practice that figure comes from the platform planners or census data for your chosen geography; here it is simply an assumption.
The budget is split 60/40 between YouTube and CTV (bought together through Google, since Reach Planner treats them as one video plan) and Meta. The first step is converting dollars to impressions and impressions to opportunities to see (OTS), using two formulas:
- Impressions = budget / CPM x 1,000.
- Average OTS = impressions / target audience. Multiply by 100 and you have gross rating points (GRPs), the traditional TV measure of total weight.
| Channel | Budget (AUD) | Assumed CPM (AUD) | Impressions | Average OTS |
|---|---|---|---|---|
| YouTube and CTV | 72,000 | 24.00 | 3,000,000 | 1.25 |
| Meta | 48,000 | 10.00 | 4,800,000 | 2.00 |
| Total | 120,000 | 15.38 blended | 7,800,000 | 3.25 |
Working through it: 72,000 / 24 x 1,000 = 3,000,000 impressions, and 3,000,000 / 2,400,000 = 1.25 OTS. For Meta, 48,000 / 10 x 1,000 = 4,800,000 impressions, and 4,800,000 / 2,400,000 = 2.00 OTS. Together that is 7,800,000 impressions, an average of 3.25 OTS or 325 GRPs. The blended CPM is 120,000 / 7,800,000 x 1,000 = AUD 15.38.
Average OTS is the number most plans stop at, and it is the least useful one. It says nothing about how those 7.8 million impressions are shared out: 3.25 could mean every adult in the market seeing the brand three or four times, or a third of them seeing it about ten times. To tell the difference, you need a reach curve.
Building the Reach Curve
Reach builds quickly at first, because early impressions mostly land on people who have not yet been served, then slows as more of each additional impression goes to someone already reached. A simple model that captures this shape is:
reach = R_max x (1 - e^(-k x OTS))
R_max is the ceiling: the share of the audience the channel can realistically reach at any budget, because some people barely use it. k controls how fast the curve rises. Average frequency then falls straight out as OTS / reach. For this example we assume Meta has an R_max of 60% and a k of 1.0, and YouTube and CTV have an R_max of 75% and a k of 0.8. Real curves come from the platform planners or from fitting the model to your own past campaigns; these parameters are invented for illustration.
Here is the Meta curve at different spend levels, all at the assumed AUD 10 CPM:
| Meta spend (AUD) | Impressions | Average OTS | Reach % | Avg frequency |
|---|---|---|---|---|
| 6,000 | 600,000 | 0.25 | 13.3% | 1.9 |
| 12,000 | 1,200,000 | 0.50 | 23.6% | 2.1 |
| 24,000 | 2,400,000 | 1.00 | 37.9% | 2.6 |
| 36,000 | 3,600,000 | 1.50 | 46.6% | 3.2 |
| 48,000 (plan) | 4,800,000 | 2.00 | 51.9% | 3.9 |
| 60,000 | 6,000,000 | 2.50 | 55.1% | 4.5 |
To check one row: at AUD 48,000, OTS is 2.00, so reach = 60% x (1 - e^-2) = 60% x (1 - 0.135) = 60% x 0.865 = 51.9%, and average frequency = 2.00 / 0.519 = 3.9.
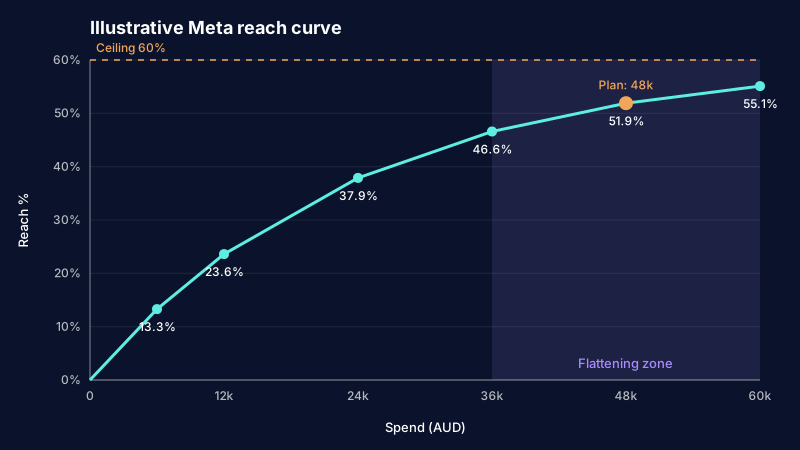
The flattening is clearest when you look at what each extra block of AUD 12,000 buys. The first AUD 12,000 reaches 23.6% of the audience. The second adds 14.3 points, the third 8.7, the fourth (taking spend from AUD 36,000 to the planned 48,000) just 5.3, and a fifth would add only 3.2. Past roughly AUD 36,000, which is 1.5 OTS, the curve has bent: most of each additional dollar is buying repeat exposures, and average frequency climbs from 3.2 towards 4.5 while reach barely moves.
That is not automatically wrong. If the brand is new or the message needs repetition, buying frequency on purpose can be the right call. But it should be a decision, not something the plan drifts into because the budget was allocated before anyone looked at the curve.
Running the same model for YouTube and CTV at the planned spend: 1.25 OTS gives reach = 75% x (1 - e^-1) = 75% x 0.632 = 47.4%, with average frequency of 1.25 / 0.474 = 2.6. At this spend the video curve is still on its steeper section.
Deduplicating the Two Channels
Adding the two reach figures gives 47.4% + 51.9% = 99.3%, which is obviously wrong: it implies almost the entire market was reached, and it counts everyone who saw both channels twice. The random duplication formula corrects for this by assuming that being reached by one channel is independent of being reached by the other:
combined reach = A + B - (A x B)
With A = 47.4% and B = 51.9%, the overlap is 0.474 x 0.519 = 0.246, or 24.6% of the audience. Combined reach is 47.4% + 51.9% - 24.6% = 74.7%, about 1,792,800 people. Combined average frequency is total OTS divided by combined reach: 3.25 / 0.747 = 4.4.
This is the same calculation as the "one minus the product of non-reach" version above: 1 - (0.526 x 0.481) = 1 - 0.253 = 74.7%.
The trouble is that independence rarely holds. The people most likely to see your YouTube ads are heavy digital media users, and so are the people most likely to see your Meta ads. Both platforms' algorithms also chase the same cheap, responsive users within the target. Correlated audiences mean overlap is higher than random, so the random formula overstates combined reach.
To show the effect, assume overlap is 25% higher than random: 24.6% x 1.25 = 30.8%. Combined reach becomes 47.4% + 51.9% - 30.8% = 68.5%, or about 1,644,000 people, and combined average frequency rises to 3.25 / 0.685 = 4.7. The 1.25 uplift is an assumption; brand lift studies, panel data or a platform's cross-media reporting are how you would calibrate it. The gap matters: around 148,800 people the random formula counts as reached never saw the campaign, and each person who was reached saw it closer to five times than four.
| Measure | Random overlap | Correlated (x1.25) |
|---|---|---|
| Overlap | 24.6% | 30.8% |
| Combined reach | 74.7% | 68.5% |
| People reached | 1,792,800 | 1,644,000 |
| Combined avg frequency | 4.4 | 4.7 |
What We'd Change
The weak point in this plan is the last AUD 12,000 of Meta. On the Meta curve alone it adds 5.3 points of reach. Once you deduplicate against YouTube with the correlated assumption, it adds even less. With Meta at AUD 36,000 (46.6% reach), the overlap is 0.474 x 0.466 x 1.25 = 27.6%, so combined reach is 47.4% + 46.6% - 27.6% = 66.4%. The final AUD 12,000 therefore lifts combined reach from 66.4% to 68.5%: 2.1 points, or about 50,400 people. That works out at roughly AUD 238 per thousand new people reached, against about AUD 21 per thousand for Meta's first AUD 12,000 (566,400 people).
We would test two changes. The first is moving that AUD 12,000 to YouTube and CTV. AUD 84,000 of video buys 3,500,000 impressions, 1.46 OTS and 51.6% reach. Against Meta at 46.6%, the correlated overlap is 0.516 x 0.466 x 1.25 = 30.1%, so combined reach is 51.6% + 46.6% - 30.1% = 68.1%: fractionally below the original 68.5%, because the video CPM is 2.4 times higher. Combined average frequency does fall, from 4.7 to 4.3 (7,100,000 impressions is 2.96 OTS, and 2.96 / 0.681 = 4.3), so the shift trades a little reach for less repetition. It is worth doing if the video inventory is genuinely reaching lighter digital users, which would shrink the correlated overlap.
The second, which we would usually prefer, is to hold the AUD 12,000 back for a lighter four-week continuity flight after the main burst. At the bottom of the curve, AUD 12,000 on Meta buys 23.6% reach at a frequency of 2.1, in weeks when the brand would otherwise be dark. That is the continuity argument from earlier in practice: the same dollars buying presence in more buying weeks, rather than a fourth and fifth exposure within the same ones.
Either way, the point of the exercise is that the decision is now visible. Without the curve and the deduplication maths, the plan would have reported 7.8 million impressions and a reach figure from each platform, and nobody would have seen that the final tenth of the budget was mostly buying repetition.
Measuring Whether the Plan Delivered
Report reach curves, not just totals: cumulative unique reach against spend over the flight, for each platform and combined. The shape tells you when additional budget stopped finding new people and started buying repeat exposures, which is the point to reallocate to another channel or hold weight for the next period. Pair that with average and distribution of frequency, because an average of three can hide a long tail of people seeing the ad twenty times.
Reach and frequency are inputs. The outputs are the brand metrics and the downstream signals we described in how brand campaigns show up in performance data. A plan that hit its reach target and moved nothing points to a creative or targeting problem.
If you want a brand plan built around reach, frequency and continuity rather than whatever the auction serves up, that is the core of our performance branding work. Get in touch.