
How Brand Campaigns Show Up in Performance Data (If You Know Where to Look)
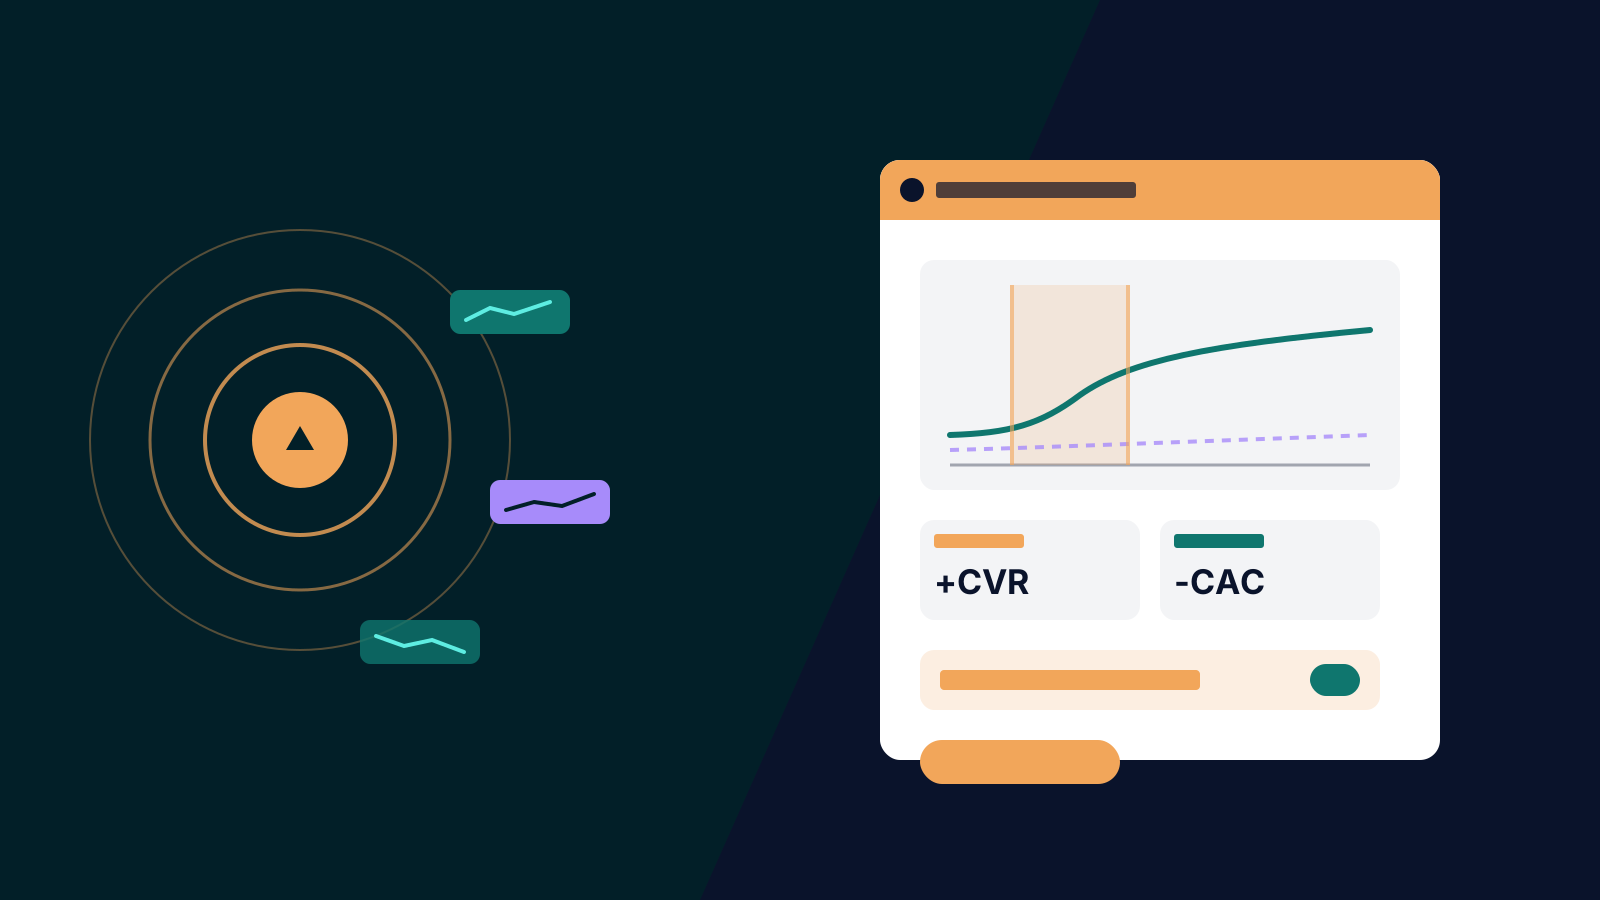
The standard complaint about brand investment is that you cannot see it working. The truth is closer to this: you cannot see it working in the place you are looking. Brand campaigns rarely produce impressive numbers in their own reporting line, because their effect shows up somewhere else, in the performance of every other channel. Attribution tools then hand the credit to whichever click came last, and the brand line looks like dead weight.
Measurement research puts numbers on how big this misdirection is. Analytic Partners' ROI Genome, drawing on thousands of modelled campaigns, finds that a large share of advertising's total impact lands as lift to other channels' performance rather than direct response, and that a meaningful fraction of paid search conversions are actually driven by upper-funnel activity that never receives credit. Their work on halo effects formalises what practitioners observe constantly: turn brand spend on and the performance channels get quietly better; turn it off and they get quietly worse, months later, for no reason the dashboards can name.
You do not need enterprise econometrics to see the halo. You need to know which signals to watch, and the discipline to watch them around your brand activity. Here is where to look.
Branded Search Volume
The fastest and cleanest halo signal. People who see effective brand advertising later search for the brand, so branded query impressions in Search Console and Google Ads, and your share of search against competitors, respond within days to weeks of campaign activity. Plot branded impression volume with your brand media flighting overlaid, and the relationship is usually visible to the naked eye. Watch the decay too: volume that stays elevated after the campaign ends is evidence of memory built, not just attention rented.
The corollary matters for budgeting: rising branded search inflates paid search performance, because brand clicks convert at several times non-brand rates. A paid search account that "got better" during a brand burst usually did not get better at paid search. Failing to make this connection leads to exactly the wrong reallocation, cutting the brand spend that caused the improvement to fund the channel that harvested it.
Conversion Rates on Unchanged Traffic
Brand strength shows up as a higher proportion of visitors who arrive already trusting you. The signal: conversion rate improvements on stable traffic sources with no landing page or offer changes, particularly in non-brand paid search, organic and direct. The same effect appears upstream in paid social as rising click-through rates at constant frequency, and downstream as improved lead quality scores. None of these will attribute to the brand campaign. All of them are the brand campaign.
Acquisition Cost Trends Over Quarters
The halo compounds. As mental availability grows, every auction gets easier: quality scores benefit from higher expected click-through on ads carrying a recognised name, win rates rise at constant bids, and blended CAC drifts down over quarters even as channel-level CPCs rise across the market. The reverse is the classic slow puncture: businesses that cut brand spend see performance hold for a quarter or two on accumulated memory, then CAC begins climbing and every channel team gets blamed except the budget line that caused it. This lag is why judging brand on in-quarter data is structurally unfair in both directions.
Direct and Organic Entry
Growth in direct traffic and branded organic entrances that outpaces your category baseline is people arriving because they remembered you. GA4 will file much of it as "unattributed" or credit it to nothing at all, since attribution models exclude direct by design. Track it as a trend against campaign periods rather than expecting any attribution tool to assign it.
Reading the Signals Honestly
Each signal alone is circumstantial: seasonality, promotions, pricing and competitor moves all push the same metrics. Three practices keep the reading honest. Annotate everything, so brand flighting, promotions and market events sit on the same timeline as the metrics. Compare against a counterfactual where possible: unexposed regions, matched market tests, or at minimum pre-period baselines, in the spirit of proper incrementality testing. And triangulate: when branded search, conversion rate and CAC all move in the brand-consistent direction after a campaign, the case is strong; when only one moves, stay sceptical.
For businesses spending enough to justify it, media mix modelling formalises all of this and returns a quantified halo estimate per channel. But the observational discipline above costs nothing and catches the big effects, and it changes the budget conversation from faith versus ROAS to evidence versus evidence.
The halo is not a metaphor. It is a set of measurable movements in data you already collect, sitting unread in most accounts. If you want help building the measurement view that makes brand and performance legible in the same frame, our measurement team does this work daily. Get in touch.