
Site Speed and Conversion Rates: Quantifying the Revenue Impact
Site speed is one of the few factors that affects every metric marketers care about: bounce rates, engagement, conversion rates, and revenue. Unlike many optimisation levers that require creative judgement or strategic bets, speed improvements deliver predictable, measurable returns. The data on this is unusually clear.
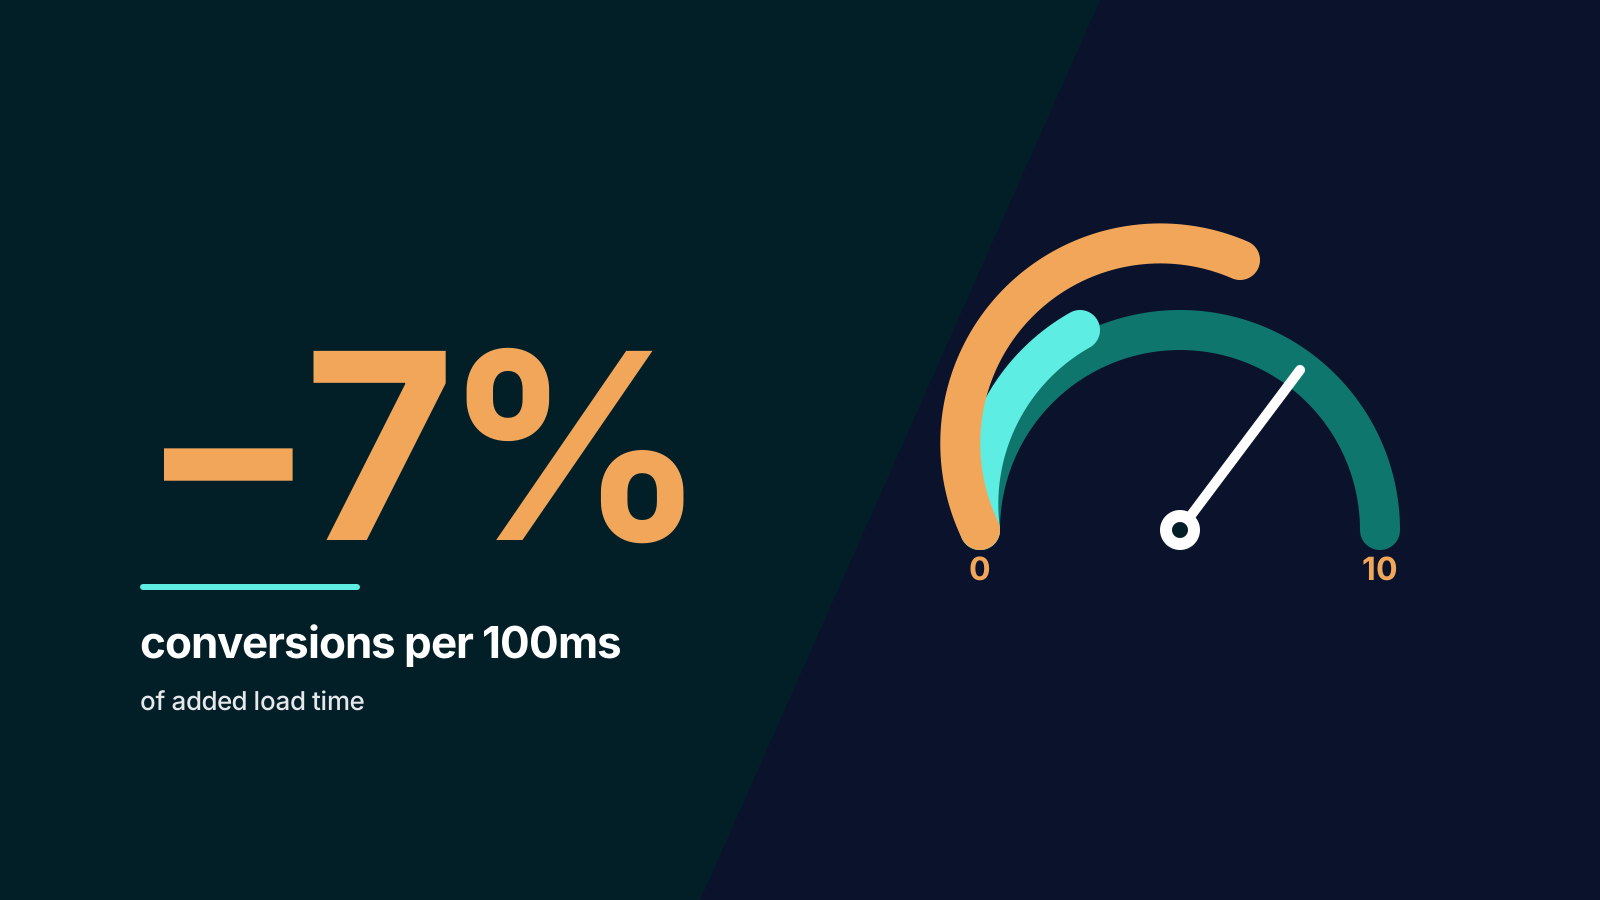
Research from Cloudflare and others shows that every 100 milliseconds of additional load time costs approximately 1% in conversions. A site that loads in one second sees conversion rates as high as 40%, dropping to 29% by the third second. For ecommerce specifically, the average conversion rate for sites loading under two seconds is 3.05%, compared to 1.94% for sites loading between three and four seconds.
Despite these numbers, site speed remains an area where many businesses underinvest. The gap between knowing that speed matters and actually prioritising the work to improve it is often a problem of quantification: teams struggle to translate milliseconds of load time into dollars of revenue. This article provides the framework for making that connection.
How Speed Affects User Behaviour
The impact of page load time on user behaviour follows a predictable curve. Performance is tolerable up to a point, and then abandonment accelerates sharply.
Bounce Rates
When mobile load time increases from one to three seconds, bounce rate rises by 32%. Extend that to five seconds and the probability of a visitor bouncing increases by 90%. Nearly 53% of mobile visitors leave a site entirely if it takes more than three seconds to load.
These are not marginal effects. A site receiving 200,000 monthly mobile visitors with a three-second load time could be losing over 100,000 of those visitors before they see a single page of content. That is not a conversion optimisation problem. It is a traffic problem.
Engagement and Page Depth
Speed does not only affect whether visitors stay. It affects how deeply they engage. Faster sites see more pages per session, longer average session durations, and higher interaction rates. The mechanism is straightforward: when pages load quickly, browsing is fluid and exploration feels effortless. When pages are slow, every click carries a cost, and visitors self-limit their browsing.
Conversion Rates
The relationship between speed and conversion is well quantified. A 0.1-second improvement in site speed increases conversions by 8.4% for retail sites and 10.1% for travel sites. These are not theoretical projections. They come from controlled studies measuring the direct impact of speed changes on real transaction data.
The ecommerce-specific data is equally compelling. The average conversion rate for sites loading under two seconds is 3.05%. Between two and three seconds, it drops to 2.67%. Between three and four seconds, it falls further to 1.94%. Each additional second of load time translates directly into lost sales.
Translating Speed into Revenue
To make speed improvements actionable for budget conversations, you need to translate them into revenue terms. Here is a straightforward framework.
For an ecommerce site generating $10 million annually, a 500-millisecond improvement in page load time translates to roughly $500,000 in recovered revenue. Slow websites cost retail businesses an estimated $2.6 billion in lost sales each year.
To calculate the potential revenue impact for your site:
- Identify your current load time using Google PageSpeed Insights or your real user monitoring (RUM) data.
- Estimate the conversion rate improvement based on the 1% per 100ms benchmark. If you improve from 3.5 seconds to 2.5 seconds, that is a roughly 10% improvement in conversion rate.
- Apply that improvement to your current revenue. If you are converting at 2% and generate $5 million annually, a 10% improvement in conversion rate adds $500,000 in revenue.
- Compare against the cost of the speed improvement to determine ROI. Most speed improvements pay for themselves within weeks or months.
Core Web Vitals: The Benchmarks That Matter
Google's Core Web Vitals provide a standardised framework for measuring page performance. Three metrics form the core:
Largest Contentful Paint (LCP)
LCP measures how quickly the largest visible element on the page renders. The target is under 2.5 seconds. Currently, 67% of websites achieve a fast LCP score. LCP is the most visible indicator of page speed from the user's perspective because it reflects when the page feels "loaded".
Interaction to Next Paint (INP)
INP measures how quickly the page responds to user interactions such as clicks, taps, and keyboard input. The target is under 200 milliseconds. Poor INP means the page looks loaded but feels sluggish when the user tries to interact with it, a frustrating experience that drives abandonment.
Cumulative Layout Shift (CLS)
CLS measures visual stability: how much the page layout shifts during loading. The target is under 0.1. High CLS means elements jump around as the page loads, causing users to click the wrong button, lose their reading position, or simply lose trust in the site's quality.
The Mobile Gap
Only 42% of mobile sites pass all three Core Web Vitals, compared to 63% on desktop. Mobile pages average 8.6 seconds to load, versus 2.5 seconds on desktop. Given that mobile now accounts for 62% of all ecommerce traffic, this gap represents a significant revenue leak for most online businesses.
The Highest-ROI Speed Improvements
Not all speed optimisations deliver equal returns. Prioritise the changes that produce the largest measurable improvements for the least effort and cost.
Image Optimisation
Images are typically the largest assets on any page. Converting images to modern formats (WebP or AVIF), implementing responsive sizing, and lazy-loading below-the-fold images can reduce total page weight by 30 to 60%. This is often the single largest speed improvement available and requires relatively low technical effort.
Critical Rendering Path Optimisation
Reduce the number of render-blocking resources (CSS and JavaScript files) that must be downloaded before the page can display. Inline critical CSS, defer non-essential scripts, and remove unused code. These changes directly improve LCP by allowing the browser to render meaningful content faster.
Server Response Time
Time to First Byte (TTFB) is the foundation of all other speed metrics. If the server takes 800 milliseconds to respond, no amount of front-end optimisation will get the page to load in under two seconds. Evaluate your hosting provider, implement server-side caching, and consider a content delivery network (CDN) to reduce latency for geographically distributed visitors.
Third-Party Script Audit
Analytics tags, chat widgets, social media pixels, and advertising scripts accumulate over time and can add seconds to page load time. Audit every third-party script on your site and remove or defer any that are not actively delivering value. A single poorly optimised tag can add 500 milliseconds or more to load time.
Font Loading Strategy
Web fonts can block rendering if not loaded efficiently. Use font-display: swap to ensure text is visible while fonts load, preload critical font files, and limit the number of font weights and styles to only those actually used on the page.
Measuring and Monitoring Speed
Speed optimisation is not a one-time project. Sites slow down over time as new features, content, and scripts are added. Ongoing monitoring is essential.
- Lab tools like Google PageSpeed Insights and Lighthouse provide controlled, repeatable measurements. Use these for benchmarking and diagnosing issues.
- Real User Monitoring (RUM) tools like Google's Chrome User Experience Report (CrUX), New Relic, or Datadog capture actual user experience data across different devices, connection speeds, and geographies. RUM data is more representative of real performance than lab tests alone.
- Performance budgets set thresholds for key metrics (total page weight, number of requests, LCP, INP) and alert your team when a deployment exceeds them. This prevents gradual performance degradation.
Google Search Console reports Core Web Vitals pass/fail rates for your entire site. Review this monthly to track trends and identify pages that have fallen below thresholds.
Where to Start
If you are unsure where your site stands, start with these steps:
- Run Google PageSpeed Insights on your five highest-traffic pages and your checkout or conversion pages.
- Check your Core Web Vitals status in Google Search Console to see how many pages pass all three metrics.
- Identify your current page load time using RUM data if available, or lab tools if not.
- Calculate the revenue impact of a one-second improvement using the framework above.
- Prioritise the highest-ROI improvements: images, render-blocking resources, and server response time.
Speed improvements are among the most cost-effective conversion optimisations available. Unlike A/B testing copy or layout changes, which may or may not produce a result, speed improvements deliver predictable, measurable returns.
If you need help auditing your site's performance and identifying the highest-impact speed improvements, our analytics team can quantify the revenue impact and prioritise the work. For technical implementation, our SEO team works on the Core Web Vitals and technical performance that affect both rankings and conversions. Get in touch to discuss how speed is affecting your bottom line.