
How to Measure the True Cost of Customer Acquisition
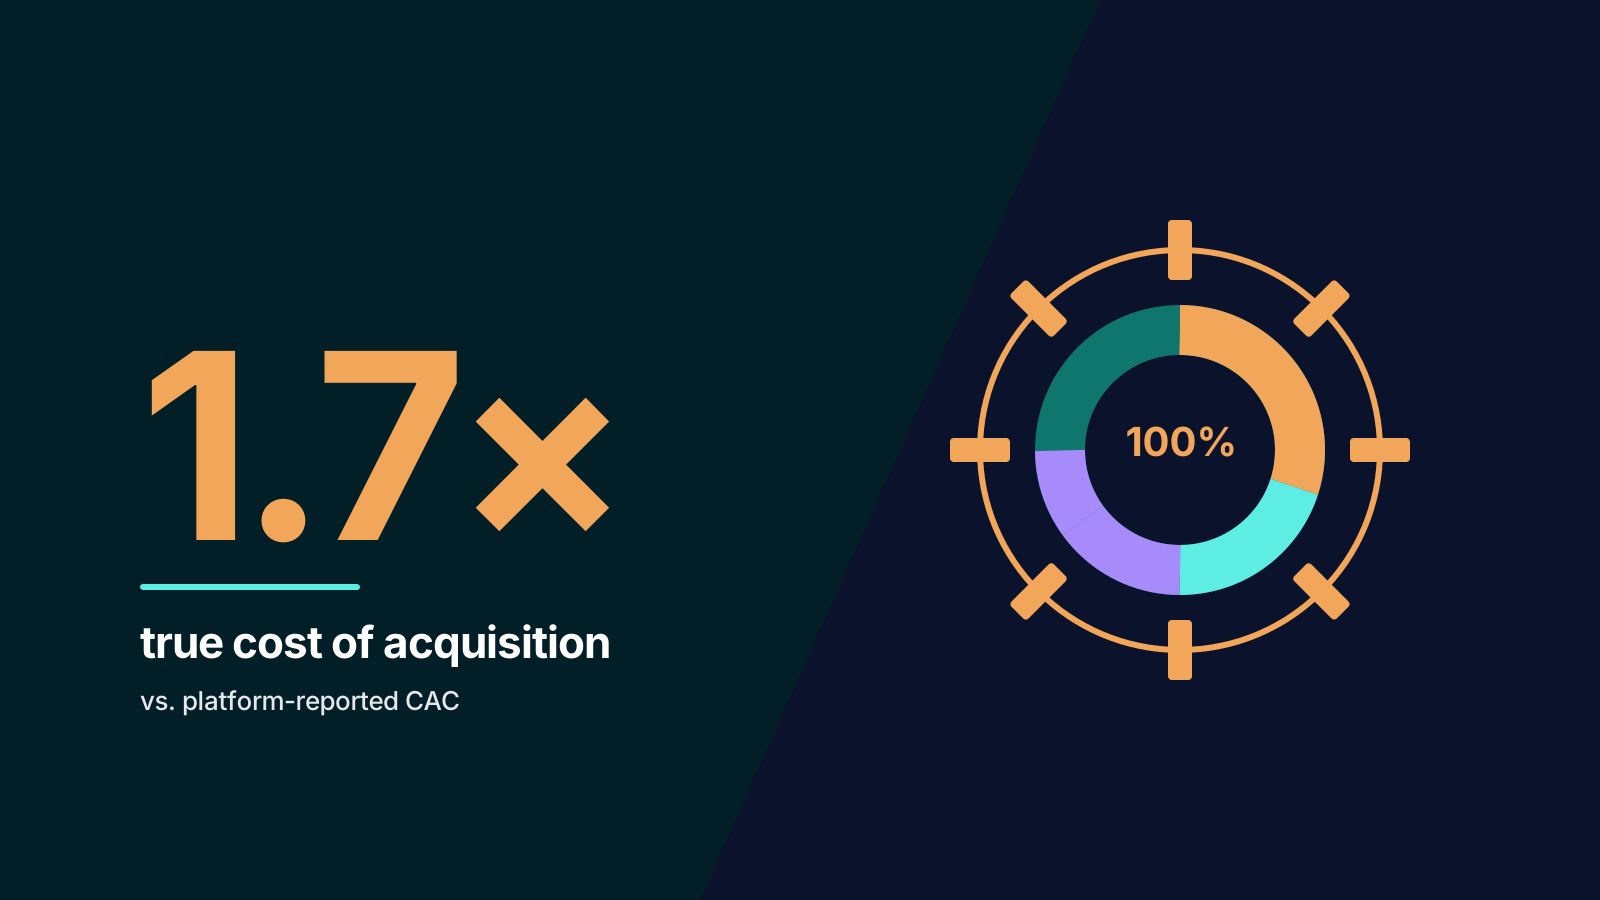
Most businesses know their customer acquisition cost. Or at least, they think they do. They take total marketing spend, divide it by new customers, and arrive at a single number. The problem is that this blended CAC hides more than it reveals. It tells you nothing about which channels are efficient and which are burning money, and it almost certainly understates the true cost of acquiring each customer.
Customer acquisition costs have risen by 60% over the past five years across both B2B and B2C businesses. In competitive sectors, the increase has been even sharper. If your measurement of CAC is not keeping pace with how costs are actually structured, you are making budget decisions with flawed data.
This article explains how to move beyond blended CAC to a more accurate, channel-level understanding of acquisition costs, what hidden expenses most businesses miss, and how to connect acquisition cost to lifetime value so you know which customers are actually worth acquiring.
The Problem with Blended CAC
Blended CAC is calculated by dividing total sales and marketing spend by total new customers acquired in a given period. It is the most commonly reported acquisition metric, and it is also the least useful for making decisions.
The core issue is aggregation. When you blend all channels into a single number, you lose the ability to identify which channels are efficient and which are not. A business spending $50,000 across Google Ads, Meta, content marketing, and events might report a blended CAC of $200. But if Google Ads is acquiring customers at $120 and events are acquiring them at $800, that single number obscures the 6x difference in efficiency.
Blended CAC also masks trends. A channel that was efficient six months ago may now be over-saturated, with rising costs per click and declining conversion rates. If you are only watching the blended number, you will not notice the degradation until it has already consumed a meaningful portion of your budget.
The fix is straightforward in principle but requires discipline in practice: measure CAC at the channel level, fully loaded with all costs that contribute to acquisition through that channel.
What Belongs in a True CAC Calculation
The most common mistake in CAC measurement is counting only media spend. Research on true cost per acquisition shows that a campaign that looks profitable at $200 CPA may actually cost $270 or more once all associated costs are included. The gap between reported and actual CAC is often 25 to 40%.
A fully loaded CAC calculation should include:
Direct Media Spend
This is the starting point and the number most businesses already track. It includes ad spend on platforms like Google Ads, Meta, LinkedIn, and any other paid channels. It also includes sponsorship fees, event costs, and direct mail production and postage.
Creative Production Costs
Every ad needs creative assets: images, videos, ad copy, landing pages. Whether produced in-house or by an agency, these have real costs. A single landing page can cost $1,500 to $3,000 to design and build. A set of social media ad variations might run $800 to $2,000. Video production for a single campaign can easily exceed $5,000.
These costs are often tracked in a separate budget line and never attributed back to the campaigns they support. If you ran a Meta campaign that generated 50 customers, and the creative for that campaign cost $4,000 to produce, each customer carries an additional $80 in acquisition cost that probably is not in your CAC calculation.
Agency and Consultant Fees
If you use an agency for campaign management, strategy, or creative services, those fees are part of your acquisition cost. Agency fees often include setup and onboarding charges ranging from $1,000 to $5,000 on top of monthly retainers. These should be allocated proportionally to the channels the agency manages.
Team Costs
The salaries, benefits, and overhead of your marketing team members who work on acquisition activities are a cost of acquisition. If a paid media manager spends 80% of their time on Google Ads and 20% on Meta, their fully loaded cost should be allocated accordingly. This is the cost most businesses resist including, but it is often the largest hidden component of CAC.
Technology and Tools
Marketing automation platforms, analytics tools, CRM subscriptions, landing page builders, A/B testing software, call tracking, and attribution tools all support acquisition activities. While these are often classified as fixed overheads, they are real costs that scale with the complexity of your acquisition efforts.
Sales Costs (for B2B)
In B2B businesses where marketing generates leads that sales teams convert, the cost of the sales process is part of acquisition cost. This includes the SDR and AE time spent on leads from each channel, CRM costs, sales enablement tools, and the cost of demos, proposals, and trials.
Measuring CAC at the Channel Level
Once you know what to include, the next step is structuring your measurement by channel. This requires two things: accurate cost allocation and reliable attribution.
Cost Allocation
Start by listing every cost category above and allocating each to the channels it supports. Some costs are straightforward: Google Ads spend goes to the Google Ads channel. Others require allocation rules. If your agency manages both Google and Meta, split their fees based on time allocation or proportional spend. If a content writer supports both SEO and email campaigns, allocate their cost based on output or time tracking.
The allocation does not need to be precise to the dollar. A reasonable estimate is far more useful than ignoring the cost entirely. Review and refine your allocations quarterly as your channel mix evolves.
Attribution
Accurate channel-level CAC requires knowing which channel acquired each customer. This is the attribution challenge that every marketing team faces, and there is no perfect solution.
At a minimum, you need:
- UTM parameters on all campaign links, consistently structured and maintained
- A CRM or analytics system that captures the acquisition source for each customer or lead
- A defined attribution model (first-touch, last-touch, or multi-touch) applied consistently
First-touch attribution is the simplest and most appropriate for CAC measurement, because it answers the question "what channel brought this customer into our world?" Last-touch attribution better answers "what channel closed the deal?" Both are useful, but for acquisition cost analysis, first-touch is usually the right starting point.
Accept that attribution will never be 100% accurate. Some customers will arrive through channels you cannot track, such as word of mouth, dark social, or podcast mentions. Build in an "unattributed" category and keep it as small as possible through disciplined tagging.
Connecting CAC to Lifetime Value
Knowing your CAC by channel is only half the picture. The other half is understanding how much revenue each customer generates over their lifetime, which determines whether your acquisition cost is justified.
The benchmark LTV to CAC ratio is 3:1 or higher. This means that for every dollar spent acquiring a customer, that customer should generate at least three dollars in lifetime revenue (or preferably, gross profit). The median B2B SaaS LTV:CAC ratio sits at 3.2:1, with top-quartile companies reaching 4:1 to 6:1.
But the ratio alone is not enough. You also need to understand the payback period: how long it takes for a customer to generate enough revenue to cover their acquisition cost.
Calculating the CAC Payback Period
The formula is:
CAC Payback Period = CAC / (Average Revenue per Customer per Month x Gross Margin)
If your fully loaded CAC is $600, your average monthly revenue per customer is $100, and your gross margin is 70%, the payback period is:
$600 / ($100 x 0.70) = 8.6 months
A payback period under 12 months is generally considered healthy for subscription businesses. For e-commerce, where repeat purchase rates vary widely, the calculation is similar but uses average order value and purchase frequency instead of monthly recurring revenue.
Why Payback Period Matters More Than LTV:CAC Ratio
The LTV:CAC ratio tells you whether a customer is profitable over their full lifetime, but it says nothing about cash flow. A customer with a 5:1 LTV:CAC ratio sounds excellent, but if the payback period is 24 months, you need significant working capital to fund acquisition before you see returns.
This is especially important when comparing channels. Channel A might have a higher CAC but a shorter payback period because its customers convert to higher-value plans faster. Channel B might have a lower CAC but longer payback because its customers start on free trials and take months to upgrade. Looking only at CAC or LTV:CAC would favour Channel B, but the cash flow dynamics might make Channel A the better investment.
CAC Benchmarks by Industry
Benchmarks provide context, but they should be used carefully. Your specific CAC depends on your market, product complexity, average deal size, and competitive landscape. That said, current industry benchmarks can help you identify whether your costs are in a reasonable range:
- E-commerce: $68 to $84 average, though this varies significantly by category. Beauty and skincare average $25 to $50, while fashion runs $30 to $80.
- B2B SaaS (self-serve): $702 median CAC. Businesses with product-led growth models tend to sit at the lower end.
- B2B SaaS (sales-led): $11,400 median CAC. Enterprise sales cycles with demos, proposals, and procurement processes drive this significantly higher.
- Financial services: $1,450 average, reflecting heavy regulation and high customer value.
- Professional services: Varies widely, but $200 to $1,000 is common depending on service value and sales cycle length.
If your CAC is significantly above your industry benchmark, investigate whether you have a cost problem (spending too much) or an efficiency problem (spending in the wrong places). Channel-level analysis will usually reveal the answer.
Comparing Channels on True Acquisition Cost
Once you have channel-level CAC calculated with all costs included, you can build a channel comparison that actually informs budget allocation. Channel-level CAC benchmarks show significant variation:
- Organic search and content: $500 to $1,500 per customer in B2B, but with compounding returns over time as content assets continue generating traffic without additional spend.
- Paid search: $802 average per customer in B2B. Cost-efficient for high-intent audiences but limited by search volume.
- Referrals: $141 to $200 per customer. Consistently the most cost-efficient channel but difficult to scale on demand.
- Events and conferences: Often $500 to $2,000+ per acquired customer when fully loaded with booth costs, travel, staff time, and follow-up sequences.
The important comparison is not just the CAC number but the ratio of CAC to customer quality. A channel with a higher CAC but better retention rates, higher average contract values, or shorter sales cycles may deliver better unit economics than a lower-CAC channel that attracts price-sensitive customers who churn quickly.
Common Mistakes in CAC Measurement
- Excluding non-media costs: The most prevalent error. If you are only counting ad spend, your CAC is understated by 25 to 40% on average.
- Using revenue instead of gross profit for LTV: LTV should be calculated on gross margin, not revenue. A customer generating $10,000 in revenue at 30% margin has an LTV of $3,000 for CAC comparison purposes.
- Ignoring cohort differences: Customers acquired in different periods or through different channels behave differently. A blended LTV masks these differences just as blended CAC does.
- Measuring too frequently: CAC calculated weekly or even monthly can fluctuate wildly due to timing of spend versus conversions. Quarterly is the right cadence for strategic analysis. Monthly is fine for operational monitoring if you smooth the data.
- Not accounting for the sales cycle: In B2B, a lead generated in January might not convert until April. If you attribute the acquisition cost to April and the marketing spend to January, neither month's CAC is accurate. Align cost and conversion windows to your average sales cycle length.
Building a CAC Measurement Framework
A practical CAC measurement framework does not require a data science team. Start with these steps:
- Audit your costs: List every expense that supports customer acquisition. Categorise each as direct media, creative, people, technology, or overhead.
- Define your channels: Create a consistent channel taxonomy. Keep it at 5 to 10 categories. Too granular and the data becomes noisy; too broad and you lose the signal.
- Allocate costs to channels: Use direct allocation where possible (ad spend goes to its platform) and proportional allocation for shared costs (team time, agency fees, tools).
- Set up attribution: Implement UTM tagging, CRM source tracking, and a consistent attribution model. First-touch for acquisition analysis, multi-touch for understanding the full journey.
- Calculate channel-level CAC monthly: Divide fully loaded channel costs by customers attributed to that channel. Track trends over time.
- Connect to LTV: Calculate LTV by acquisition channel and cohort. Compute the LTV:CAC ratio and payback period for each channel.
- Review quarterly: Use the channel comparison to inform budget reallocation decisions. Shift spend toward channels with strong LTV:CAC ratios and short payback periods.
Measuring What Matters
The businesses that allocate marketing budgets most effectively are not the ones that spend the most or the least. They are the ones that understand, with precision, what each customer actually costs to acquire and how that cost compares to the value that customer creates.
Moving from blended CAC to channel-level, fully loaded acquisition cost measurement is one of the highest-leverage improvements a marketing team can make. It does not require new tools or new data sources. It requires the discipline to count all costs, attribute them accurately, and connect them to customer lifetime value.
If you need help building an acquisition cost measurement framework or connecting your marketing spend to revenue outcomes, our analytics team works with businesses to turn marketing data into budget decisions. For teams looking to improve acquisition efficiency across paid channels, our demand generation team can help identify where your spend is working hardest. Get in touch to start the conversation.